For another short detour from information security...
Climate policy is again in the news. The past year has seen record high temperatures, the election of a US President who claimed global warming was a hoax invented by the Chinese (then later backed off), and the 10th anniversary of probably the most authoritative decision regarding climate policy in the US: Massachusetts v. EPA (Argued Nov 29, 2006; decided Apr 2, 2007). So it is a good time to review some of the proposed policies and debates. I have been keeping a cheat sheet of the most common claims around climate change and the data behind them, as well as the questions I have not had time to run down yet. There has been some recent concern that governmental agencies will not keep many of these sites online, so I added many of the links to archive.is. I was surprised that most of them had not been archived before. So perhaps this list will be helpful.
Science is defined by the scientific method; making observations, formulating hypotheses, specifying testable predictions, and validating them. If the predictions are vague or do not match reality, it would not be wise to base decisions on them. But if they continue to pass the tests, ignoring them comes at our peril.
The main points of debate have swirled around proposed laws like emissions or fuel efficiency regulations, or international proposals, such as those negotiated in Kyoto and Paris, to tax or otherwise restrict the use of fossil fuels emitting CO2, based on the following ideas:
A. The earth is getting warmer
B. The warming of the earth is primarily caused by increasing levels of CO2 in the atmosphere
C. The increase in levels of CO2 is primarily caused by human activity; burning fossil fuels which emits CO2
D. The consequences of global warming are bad for humanity
E. The economic costs of tighter CO2 restrictions and regulations are less than the benefits from the reduction in climate change caused by that policy
So what is the evidence behind these claims?
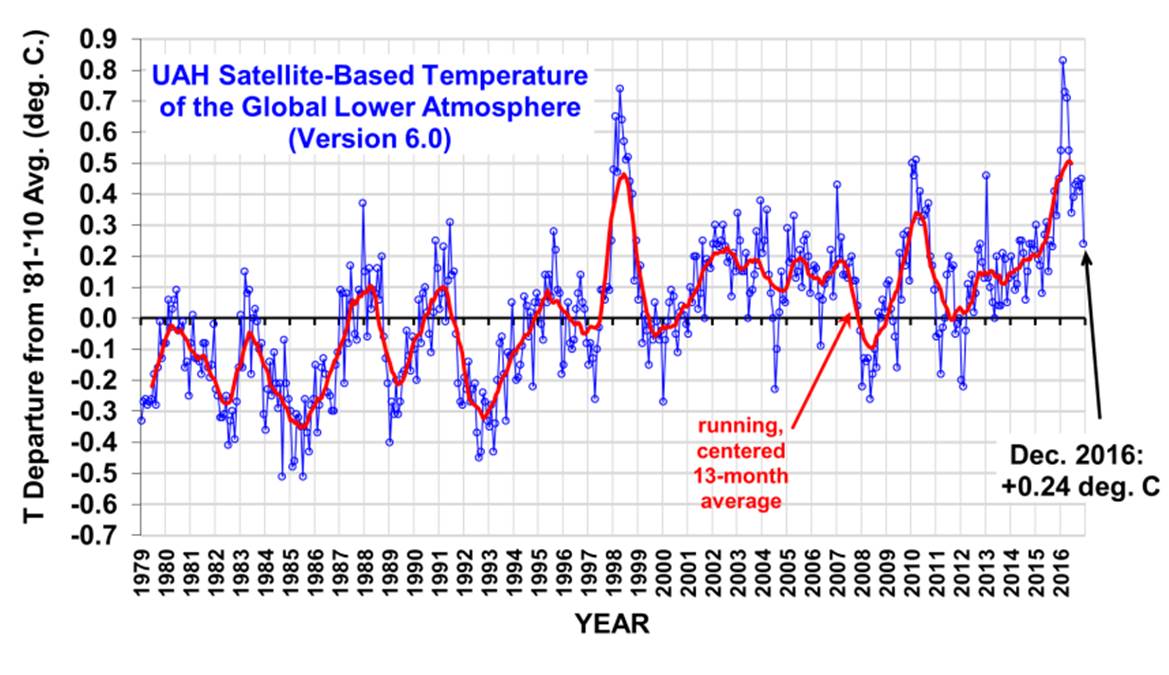
A. The earth is getting warmer: Debate in this area tends to swirl around specific allegations of data tampering and framing. In many datasets, the raw data does not show as much of a warming trend as the datasets adjusted to correct for measurement errors. Without getting into much detail, these differences are not significant. (Dr. Curry archive) Another debate concerns interpretations of the two primary satellite temperature data sets. Ground measurements can only measure specific points and are often located near cities or other nearby features that are locally warmer, but satellite measurements can cover virtually the entire globe. The satellite measurements showed a large global temperature increase during the 1998 El Nino, yet little to no warming trend for around the next 19 years (a.k.a. The Pause climatedepot.com archive):
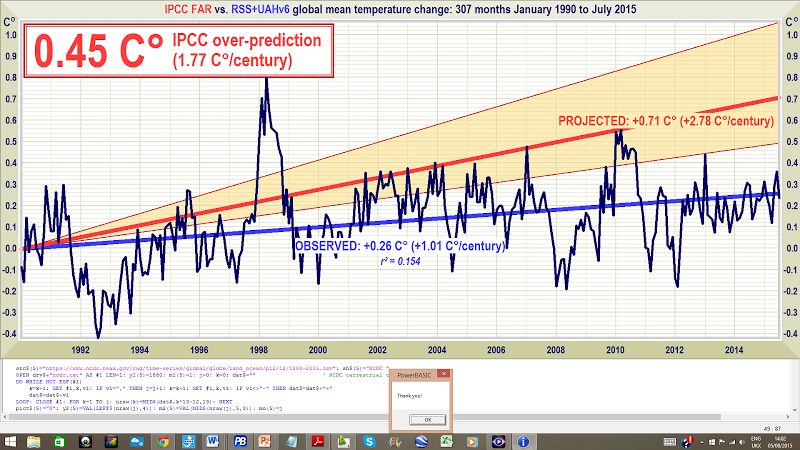
On the other hand, when 2014-2016 reached new peak temperature heights, many were quick to seize upon these individual years as proof of warming. A proper perspective; what most climate scientists insist (e.g. Dr. Spencer archive) is to look at the whole dataset and not cherry-pick unusual peaks to start at or take out.
Despite being generally below the predictions by the IPCC's First Assessment Report, a warming trend is clearly well-established.
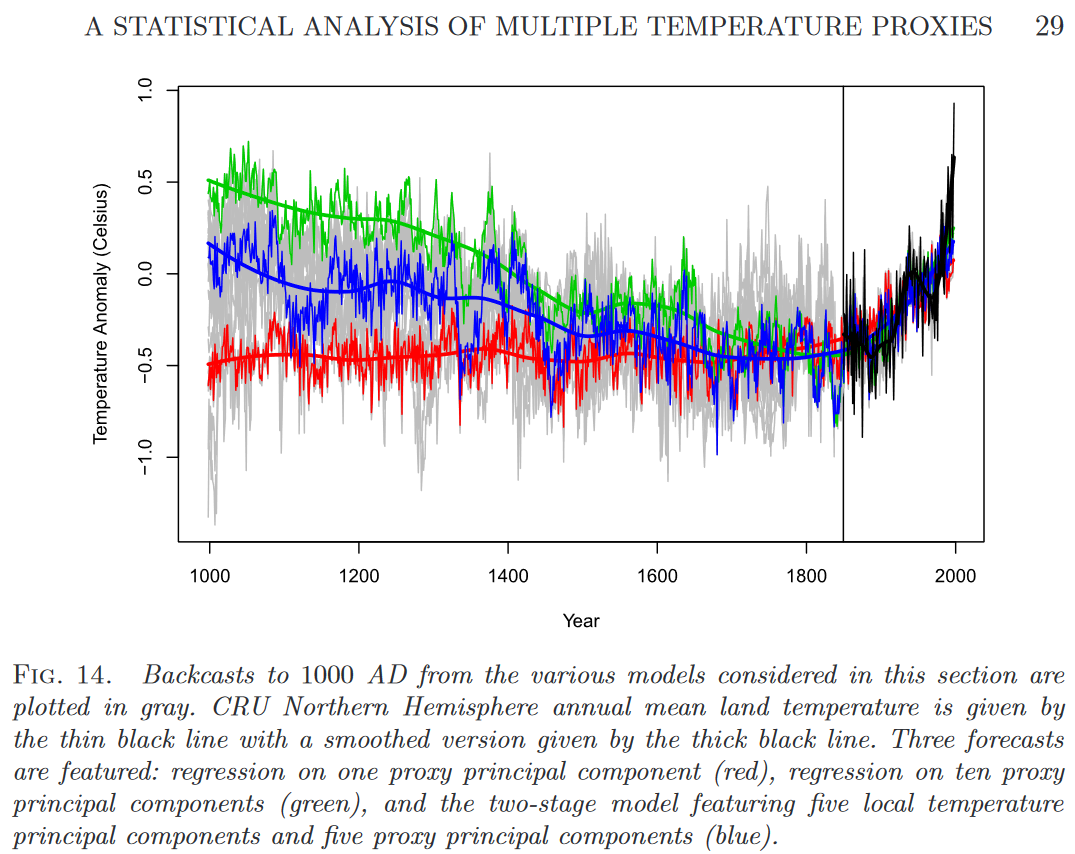
B. Global warming is caused by CO2: CO2 has been identified as the primary driver of climate change by the IPCC; with a much larger effect than any other greenhouse gas. The longest-running measurements of atmospheric CO2 are from the Mauna Loa Observatory; those along with more recent measurements all show steadily increasing CO2 levels, at least in the past half century. (noaa.gov archive) The greenhouse gas effect is well-established, and although there is disagreement over the net effect and confidence intervals of second and higher-order effects, since the temperature has also been increasing over that time period, the cause-effect relationship is clear. The other controversy in this area is in the various "hockey stick" graphs of reconstructions of temperature through the past 1000 years. These graphs show relatively stable, slightly declining temperatures until a sharp increase began around 150 years ago and provide further evidence the industrial revolution and subsequent fossil fuel burning caused the current warming. The graphs are built from measurements of "proxies" such as ice core or tree ring measurements that do not directly measure temperature, but are related to the temperature. Analyses of the data by statisticians (Dr McShane/Dr Wyner) show selection of statistical methods by some of the original authors to create the most well known graph may not have been the best choice and may have been selected to reduce the medieval warm period and accentuate the hockey stick shape. But even the other, more standard statistical techniques, which show higher temperatures in the medieval warm period then a decline in temperature until 150 years ago, still show a sharp change toward increasing temperatures since the industrial revolution, corresponding with the increase in human CO2 production.
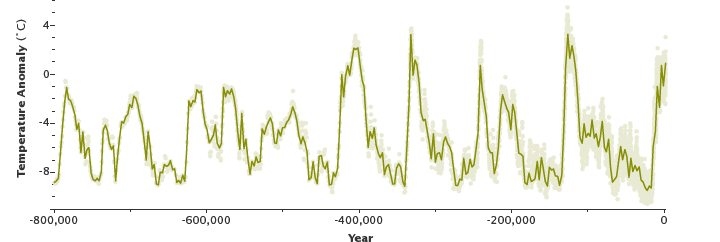
 The last point of contention is simply how far back to plot the temperature graph. If instead of plotting 1,000 years, you plot 20,000 years or more, you'll find enormous increases in temperature since the end of the last ice age thousands of years before the industrial revolution which make the last 150 years' increase seem small, although at a much higher rate than the average post-ice-age warming. Reconstructions beyond that show a cycle of ice ages and warm periods for hundreds of thousands of years. (nasa.gov archive) These of course do not affect the fact that CO2 causes warming, they just show some of the magnitude of historical natural climate change.
C. The increase in CO2 is caused by human fossil fuel use: Some of the biggest evidence for this is by measuring the levels of carbon-14 in the CO2 in the atmosphere; (noaa.gov archive) C14 is created by cosmic rays impacting the upper atmosphere and decays at a known rate; leaving roughly constant levels of C14 in the atmostphere (although nuclear testing created more) but when carbon is trapped in fossil fuels in the ground, the carbon-14 decays nearly entirely without being replenished. As a result, CO2 released from the burning of fossil fuels increases the total amount of carbon-12 in atmospheric CO2, but not so much the carbon-14; this is what we have observed happening. Plausible arguments questioning the manmade component of atmospheric CO2 are summarized by (mdpi.com archive) as "it is widely acknowledged that increasing temperatures should increase the natural CO2 emissions from soil respiration [110,111] as well as reducing the solubility of CO2 in the upper oceans [112] (which could potentially lead to net outgassing of CO2 into the atmosphere). For this reason, several researchers have argued that some component of the observed increase in atmospheric CO2 since 1959 could be a result of a natural global warming trend (i.e., the opposite of the human-caused global warming theory), e.g.,refs. [16,17,74,75,77,79–81,85,113]. Importantly, this paradigm does not rule out a contribution from anthropogenic emissions in the recent increase—rather, anthropogenic emissions are treated as an additional source that needs to be taken into account." In other words, the natural warming cycle can also cause the release of long-term stored CO2. However, the same paper references "compiled estimates of the national and global emissions" of CO2 over the past few centuries and notes that the yearly increase in atmospheric CO2 over the past few decades hovers around 44% of the quantity of CO2 released by humanity. In other words, humans are releasing lots of CO2, and the earth is absorbing on average more than half of it to get the net increase in atmospheric CO2 concentrations we see.
D. The consequences of global warming being bad for humanity. Specifically, the Mass v. EPA decision listed 5 negative consequences of global warming as justification for regulations. In their words:
1. A precipitate rise in sea levels,
2. Severe and irreversible changes to natural ecosystems,
3. A significant reduction in winter snowpack with direct and important economic consequences, and
4. Increases in the spread of disease and
5. The ferocity of weather events.
The latest IPCC report in 2014 primarily makes predictions for up to the year 2100. Keeping in mind the literature of 100 years ago was quite unable to foresee the technological and economic and societal changes in the generations since then; (and probably everyone reading this will be dead by then, the homes you are living in will likely not last that long, etc.) speculating on a longer timescale than the IPCC forecasts would be unreasonable.
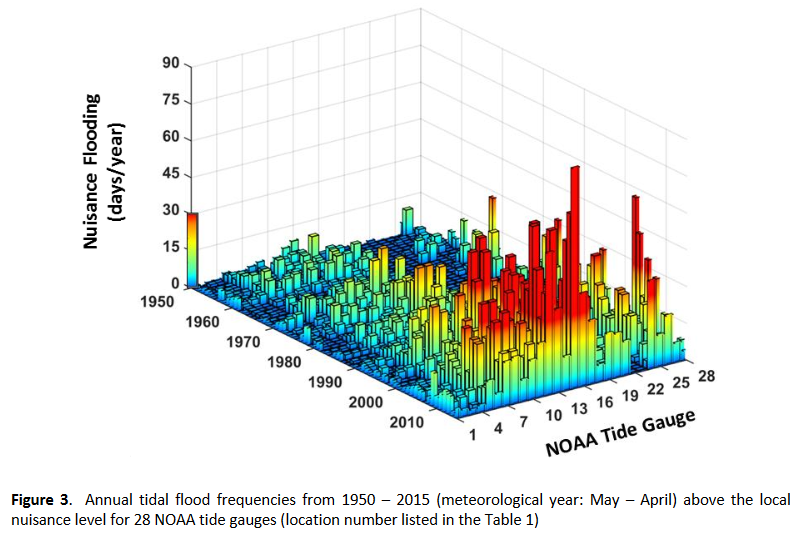
1. The 2014 IPCC report predicts about a 2-foot rise in sea levels by 2100 if no policy changes are made, due to melting snow and ice and thermal expansion of water. (ipcc.ch) The obvious harm to people from rising sea levels would be loss of valuable property to the sea. And yet, simulations of sea levels beyond even the IPCC's worst-case sea level rise by the year 2100 finds so little land lost to the sea in populated areas (and generally) it is almost undetectable: 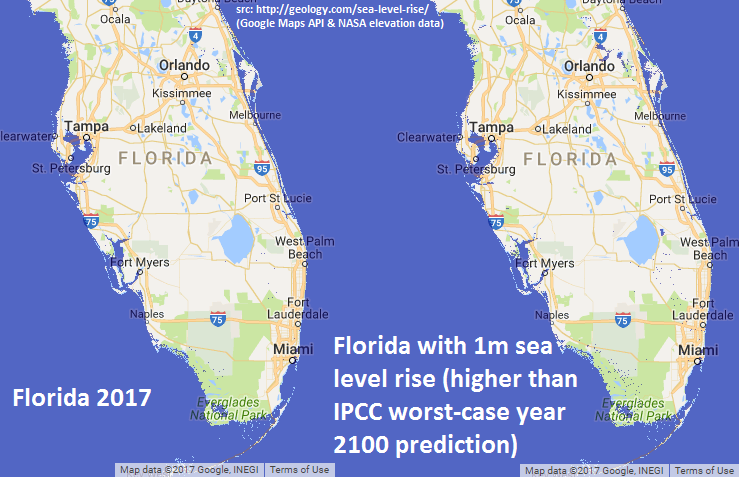 Nevertheless, NOAA records still show a significant increase in "Nuisance Flooding" (elevated high tides) over the past 60 years: noaa.gov archive The increase in erosion and flooding due to sea level rise appears poised to be more of a nuisance for coastal property owners than an apocalyptic threat, but nevertheless is likely to result in real costs.
2. Changes in natural ecosystems is a broad topic, but we can get a sense of what future warming will hold by looking at the effects of warming in the past. For example, (archive) since last glacial maximum 20,000 years ago, sea levels have risen about 120 - 140 meters as the glaciers melted and the earth dramatically warmed.
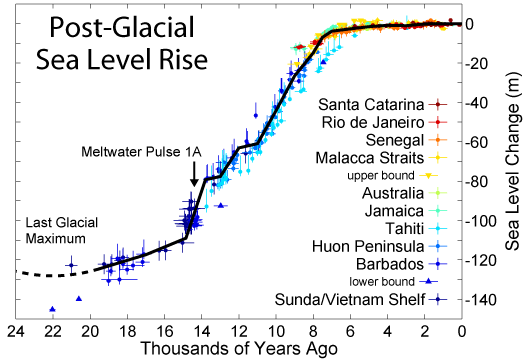
This large natural change has generally resulted in vastly increased natural ecosystem growth and diversity as previously frozen tundras gave way to forests, wetlands, and prairies. This century we may see another < 1m sea level rise and associated warming, although faster than the average rate in the past, it would be an additional change of < 1% of the same magnitude in the same direction, suggesting similar effects.
But some have predicted negative effects; recent news stories on the drought we experienced a few years ago in Texas or the recent droughts in California frequently suggested they were driven by climate change; implying the warming climate would reduce rain. I was unable to find a global or US plot of drought area and duration over the past few decades, but NOAA does provide figures for rainfall totals over the past about 110 years: (archive)
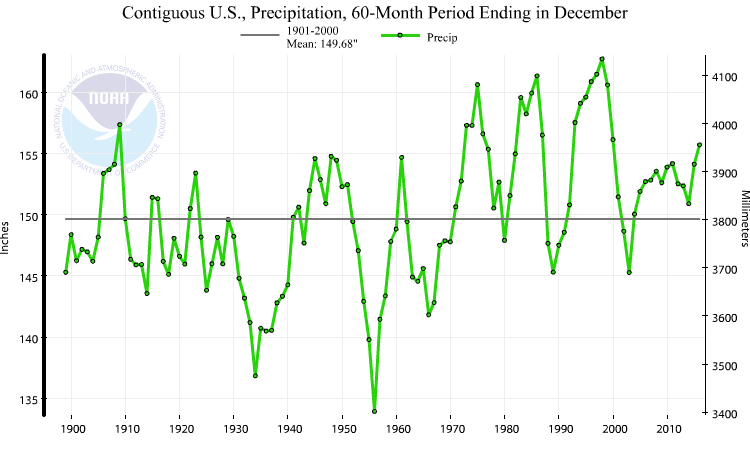
As you can see, despite the droughts and variations, rainfall has been generally slowly increasing over the past century. Rather than anticipating less rain, you should probably be anticipating more. This is one of the reasons I dislike the phrase "Climate Change" - it can easily become an intellectually lazy excuse to blame any unusual weather on; like spirits to animists. At least "global warming" implies a specific, testable process.
Related to drought, another common allegation is that wild fires are becoming more common or worse, especially every time some fire does happen. Yet in a time when NASA has satellites constantly monitoring wild fires, articles trying to insinuate that the earth was burning more seem to avoid showing any graph or data on how much the earth was burning. If you do put together such a graph, you see a different trend:
 Global burned area has been on a significantly declining trend since comprehensive satellite data has been collected. (data from NASA MODIS archive) Wild fire is decreasing, not increasing.
For more specifics on other natural ecosystem changes, see below:
3. Loss of winter snowpack is predicted to to result in a number of concrete negative effects: "Millions of people in the West depend on the melting of mountain snowpack for power, irrigation, and drinking water. In most western river basins, snowpack is a larger component of water storage than human-constructed reservoirs. Changes in mountain snowpack can affect agriculture, winter recreation, and tourism in some areas, as well as plants and wildlife. For example, certain types of trees rely on snow for insulation from freezing temperatures, as do some animal species. In addition, fish spawning could be disrupted if changes in snowpack or snowmelt alter the timing and abundance of streamflows." (epa.gov archive)
So, keeping in mind snowpack has been measurably declining over the past decades, let's see how those predictions have panned out, one at a time:
i. Agriculture: Snowpack has declined, but agricultural production has steadily increased globally and in almost every continent
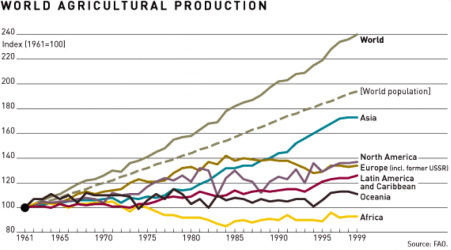
(Waugh archive) while farm-based labor has continued to decline
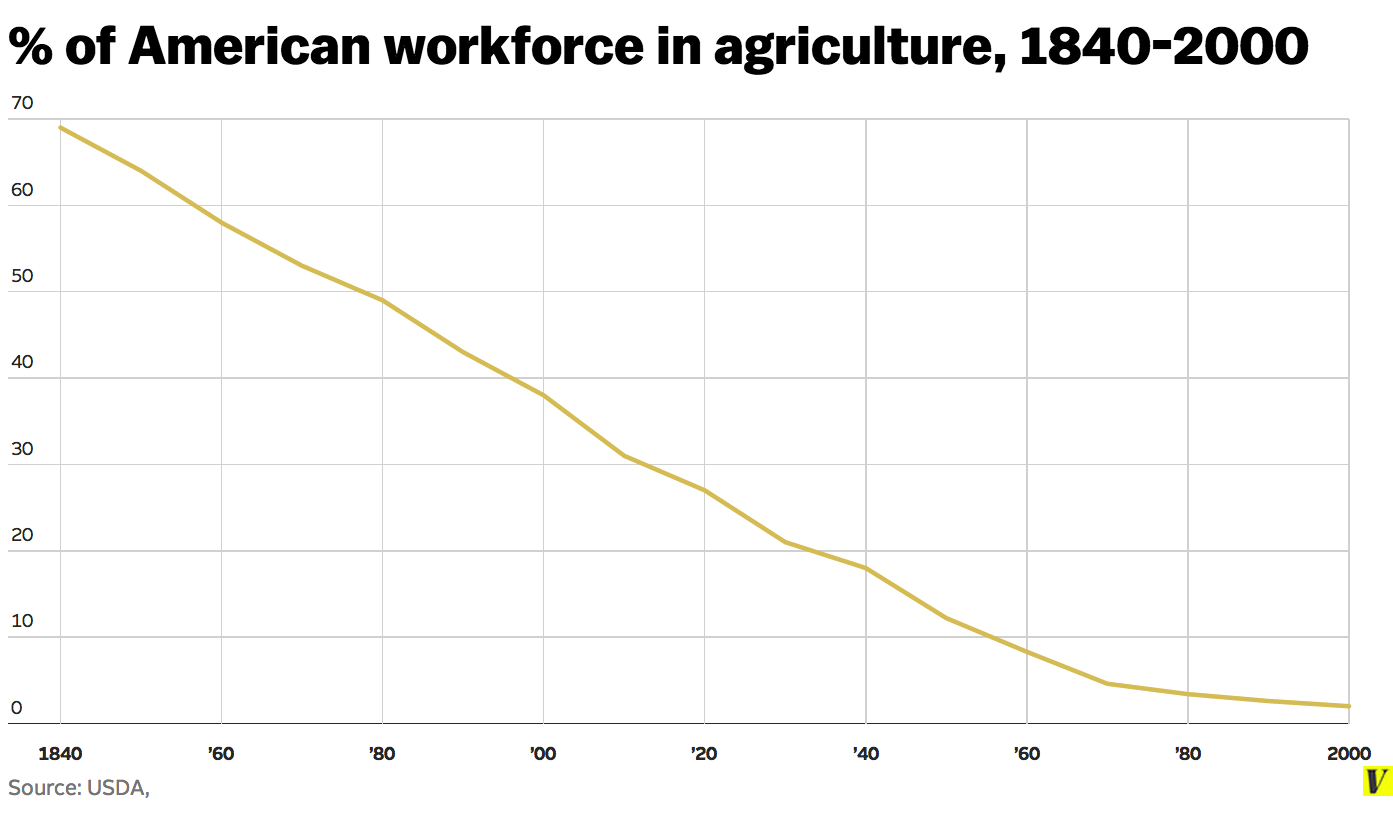
(vox archive). While some areas may become less suited for ag, more will become more suited for it; warming in the past 20,000 years has resulted in significantly more usable land for agriculture and vast amounts of northern land that is primarily rendered unusuable for agriculture due to being too cold, while the hottest countries grow very large & diverse ecosystems and have the highest concentration of plant growth.
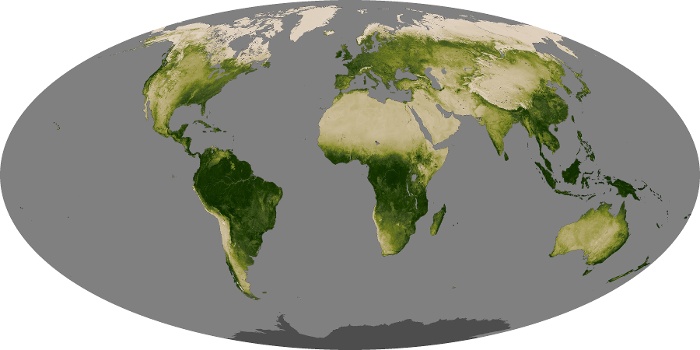 Vegetation across the globe in April 2022 (NASA Earth Observatory archive)
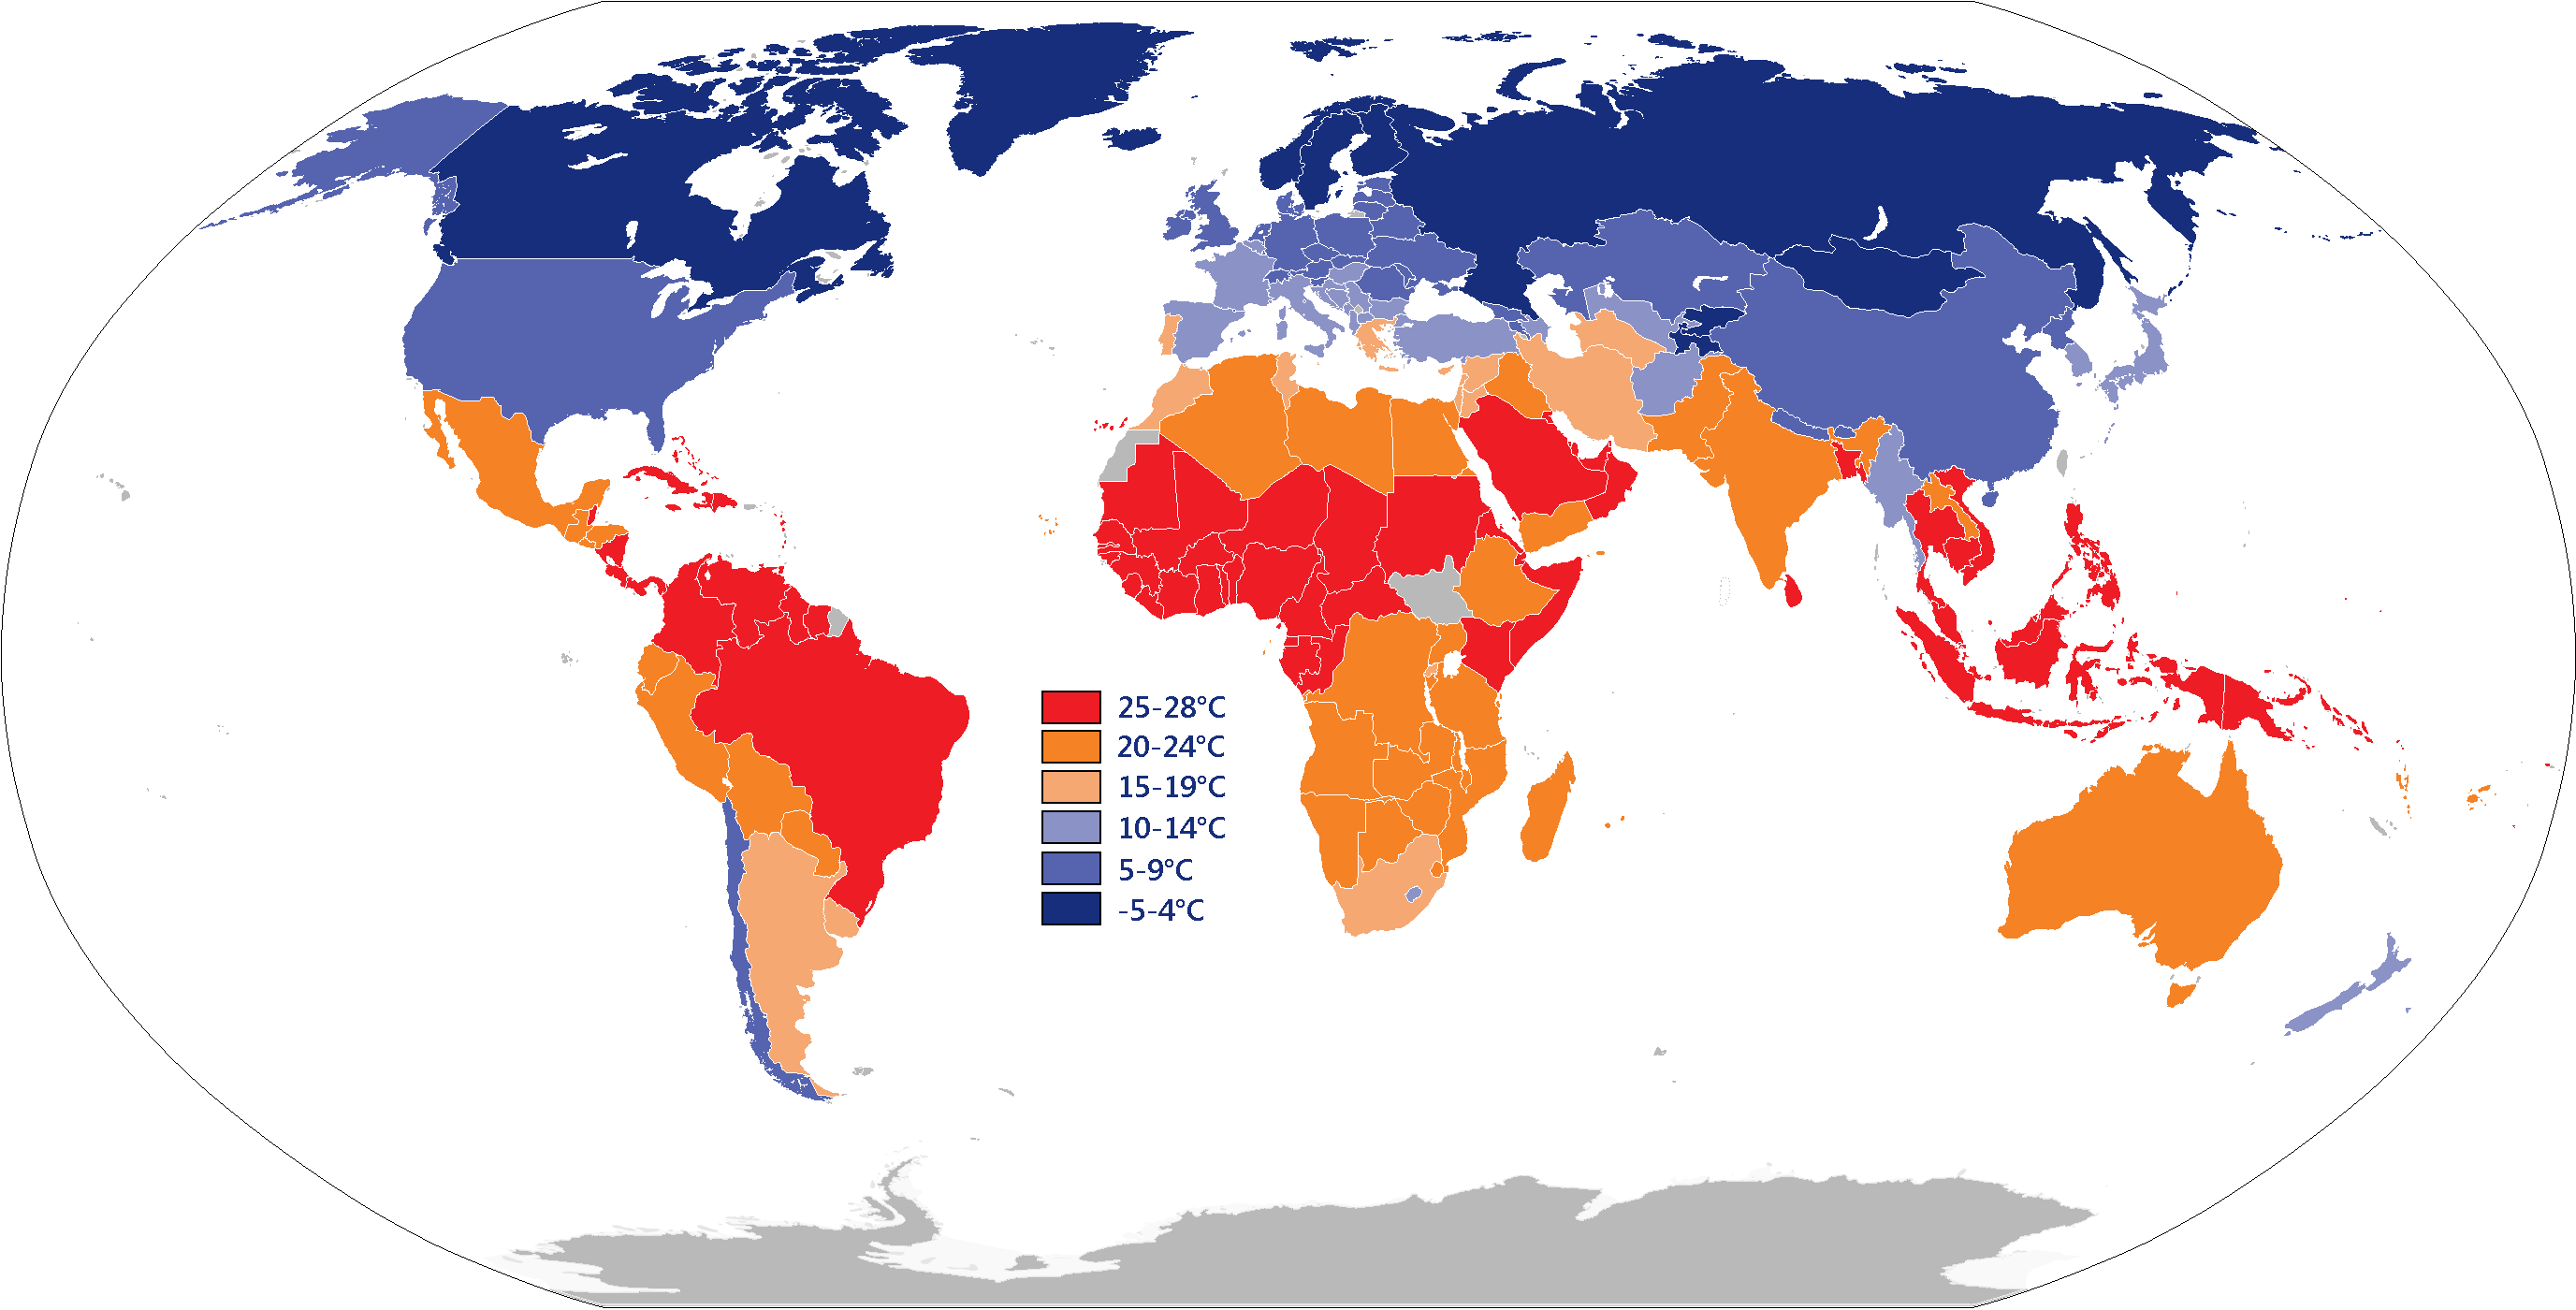 Average yearly temperature across the globe (Data from Climatic Research Unit archive)
The countries with the highest temperatures have, with almost no exceptions, the greatest plant growth, while the coldest areas are most barren and likewise unsuitable for habitation and food production, including an entire continent and much of the two largest countries by area, Russia and Canada, which have average temperatures below freezing. If none of the world is too hot for the most abundant ecological life, and much of the world is too cold for it, increasing temperatures can be expected to increase food production and habitable area, as they have consistently done over the past millennia.
In other words: predictions have been made of agricultural declines, per-farm productivity declines, or overall food shortages, but the reverse of all three has happened during warming. If these trends continue, we expect to see more areas open up to agriculture than become unsuited for it.
ii. Winter recreation & tourism: Having grown up in a northern US state, I had to laugh a bit at this one. Suppose there is a temperature at which skiing/snowboarding is no longer great; say 40F. If you query high and low temperatures for most popular winter resort in the US, Jackson Hole, for all 145 days from the beginning of the season until now (You can use wunderground's CSV API and this PowerShell script) then look at the highs; 66 are below our cutoff, while 80 are above. Now suppose the IPCC's predictions come true and the temperature rises an average of 2 degrees over many decades. There would be some variation, but we see two days out of the entire season so far which were below our cutoff that would now be above our cutoff. If you set the cutoff to 60F, it would be 3 days. And precipitation, as already mentioned, is not going down around the US either. In other words, the season becomes 2-3 days shorter, which is only 1% difference. And that does not even talk about the increased opportunities for the far more lucrative summer/spring/fall recreation, when far more people take vacation (AYTM survey archive). A ~1% decrease in suitability of certain areas for the minor tourism season with an increase in areas suitable for the major (far larger and longer) summer tourism season is not a net harm.
iii. Trees & animals: The total number and size of trees in the country has dramatically increased in the last 150 years. ("By 1997, forest growth exceeded harvest by 42 percent and the volume of forest growth was 380 percent greater than it had been in 1920." UN FAO archive and up-to-date figures estimate US timber land stocks were 16% greater in million cubic feet than in 1997 US Forest Service archive)
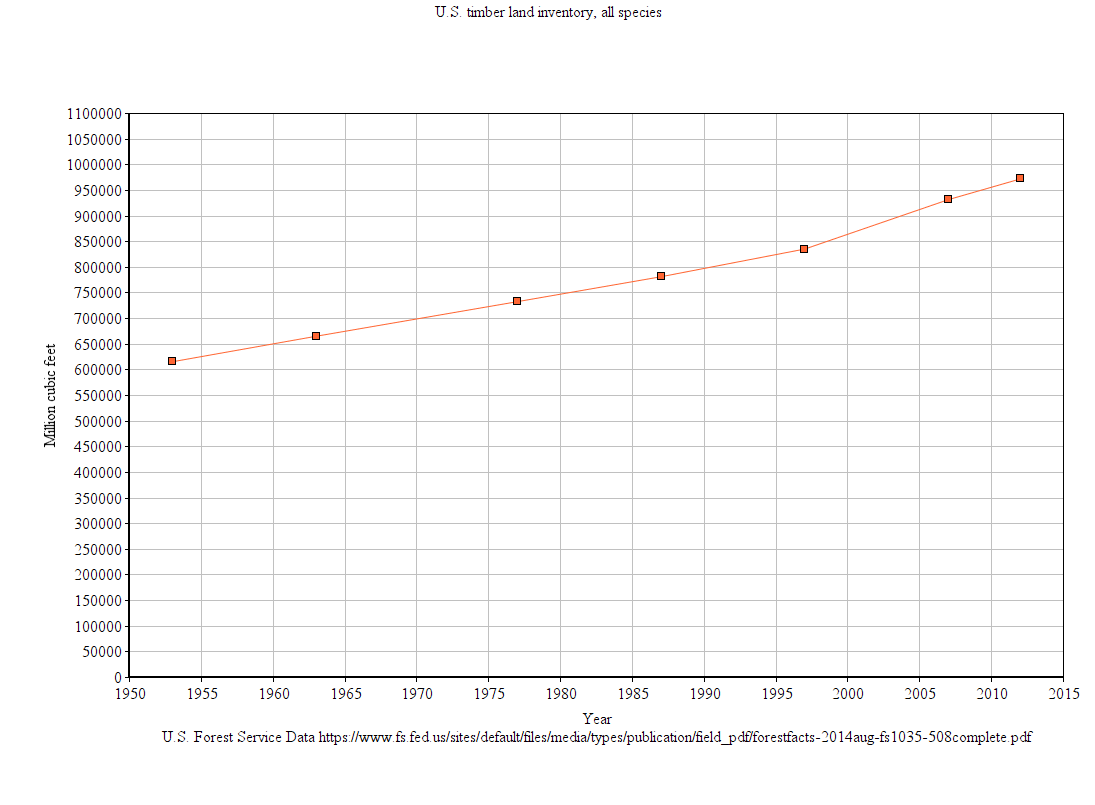
This has happened for a variety of reasons, primarily economic, but increasing CO2 concentrations are well established (climatecentral.org archive) to increase ability of plants to grow (the "CO2 fertilization effect"). While there may be some losses in some areas, there's no doubt the total tree coverage and overall plant growth has improved dramatically, has continued to grow as temperatures have risen, and with it, habitable ecosystems for a wide variety of animals.
4. Increasing heat and sea levels have been predicted to cause increased vector-borne diseases like malaria and water-borne diseases. However, despite the increase in world temperatures, malaria death rates continue to decline worldwide, a few percent a year; a snapshot of which is shown below:
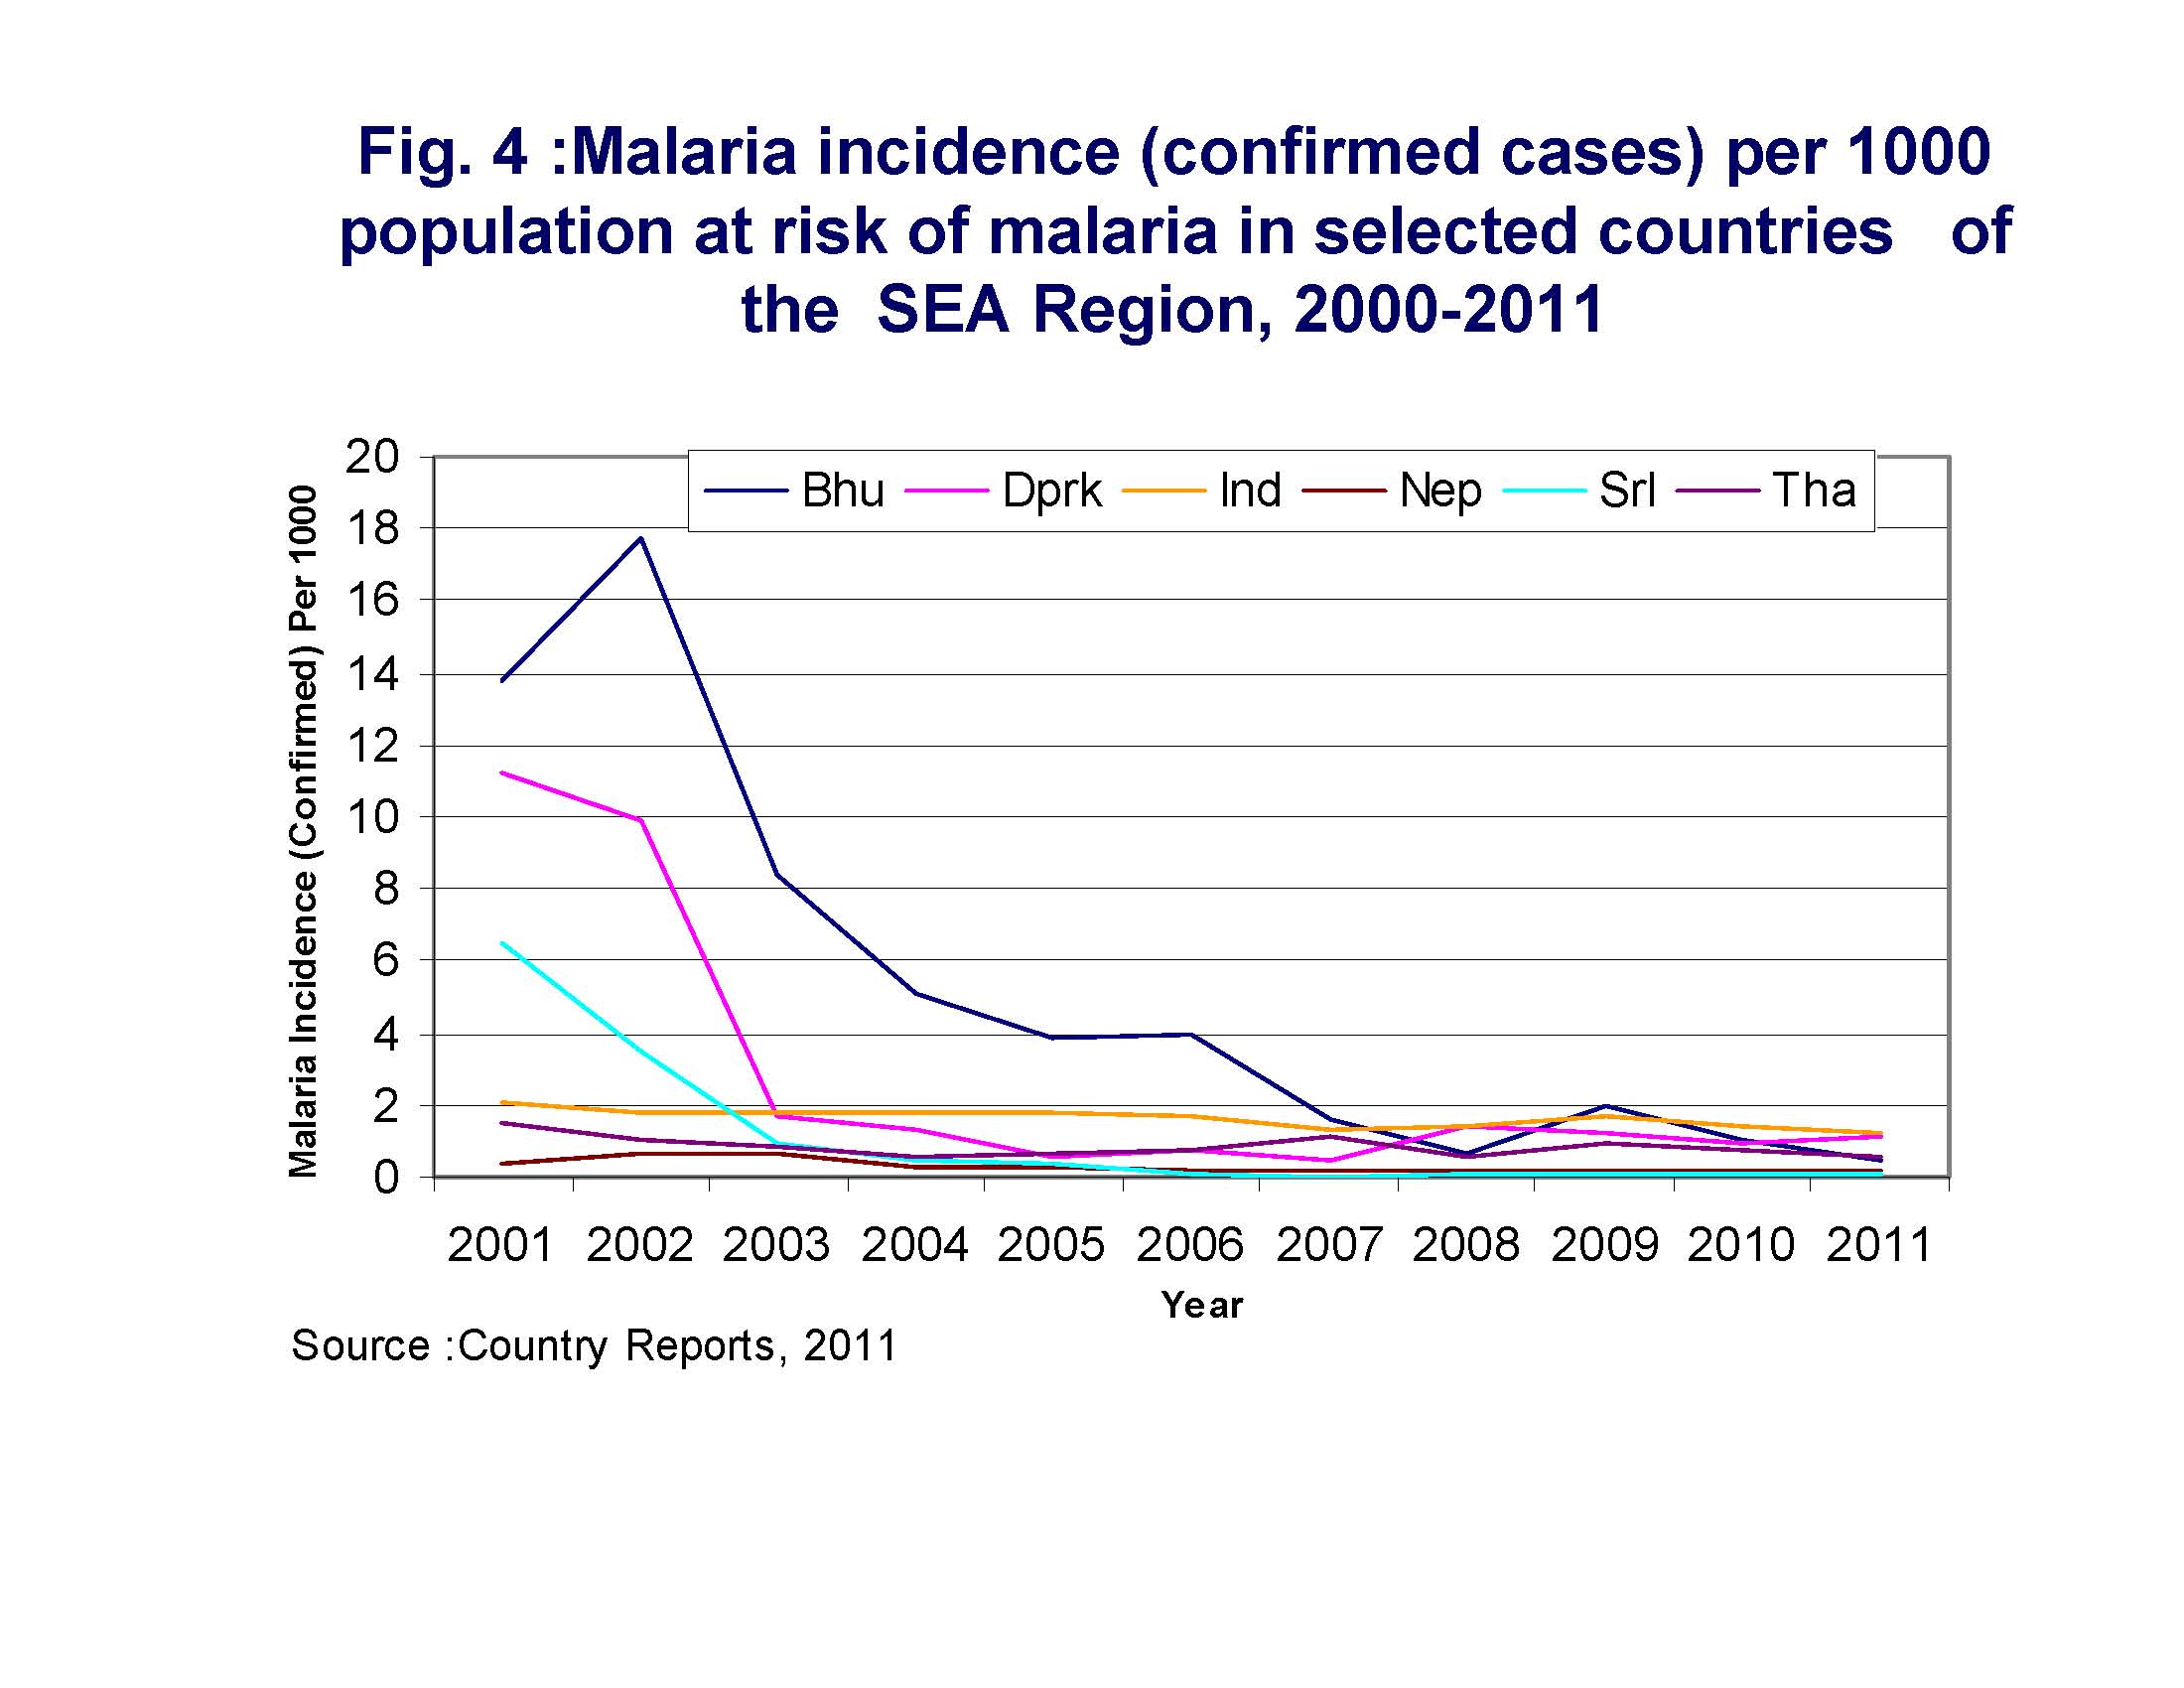
(WHO archive) Likewise, waterborne diseases have also had a dramatic decline in the US (I did not find worldwide figures) in the early two thirds of the 20th century, (CDC archive) while continuing a general trend of decline in more recent years (CDC archive). This is likely due to the fact that by far the biggest difference in all infectious disease death rates is in developed vs poor countries; about 4200% higher mortality rates in poor countries (admc.hct.ac.ae archive).
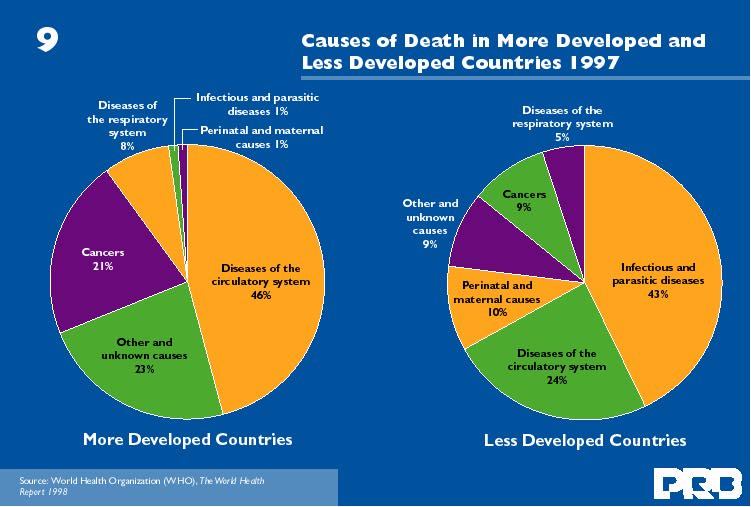
Undoubtedly, the best way to reduce mortality rates is to take steps to encourage economic growth, which makes an overwhelmingly larger difference than the temperature.
5. Increases in the ferocity of weather events has also been predicted as the earth warms. This is one of the most specifically testable predicted negative outcomes of global warming. So let's see how it has panned out as the world has warmed. It certainly has not been the case for the two most ferocious kinds of storms (with the highest wind speeds), hurricanes: (NOAA archive)
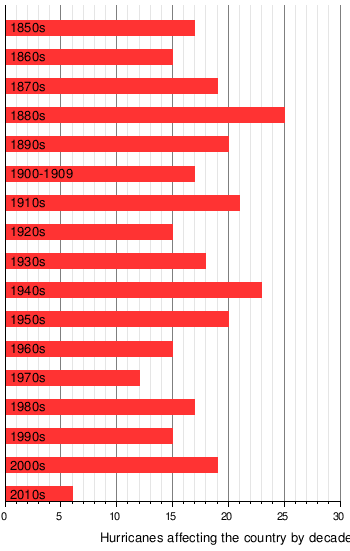
(alt Wikipedia) and tornadoes: (NOAA archive),
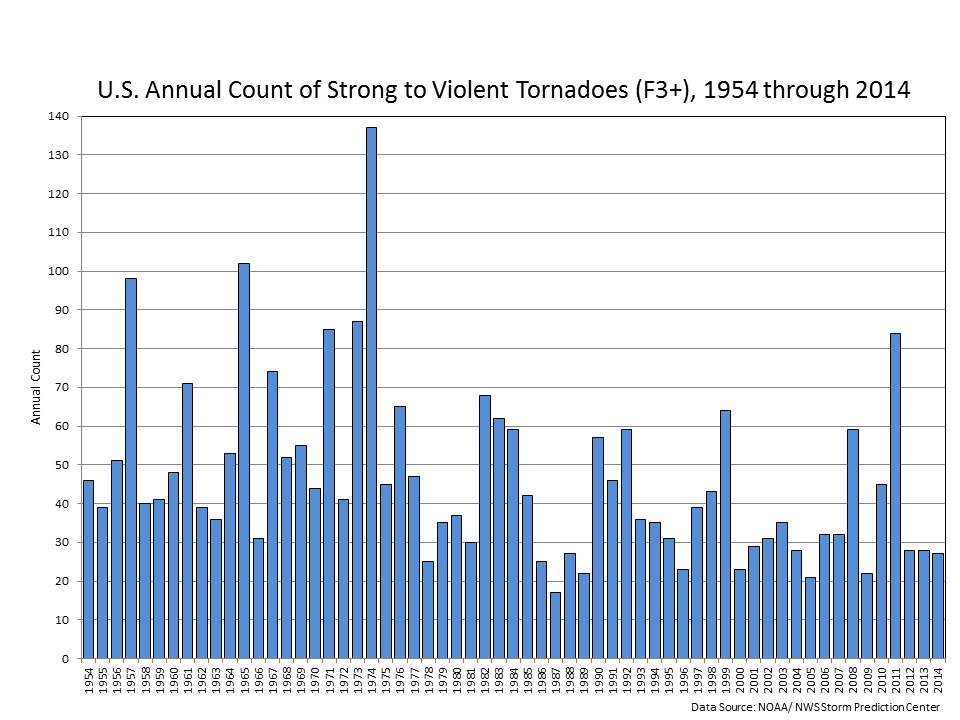
both showing slight declines decade over decade for the past 50-100 years as the earth has warmed. A common error to make here is to look at rising costs of severe weather; but the economic costs of storms are driven by rising property values and increasing population density.
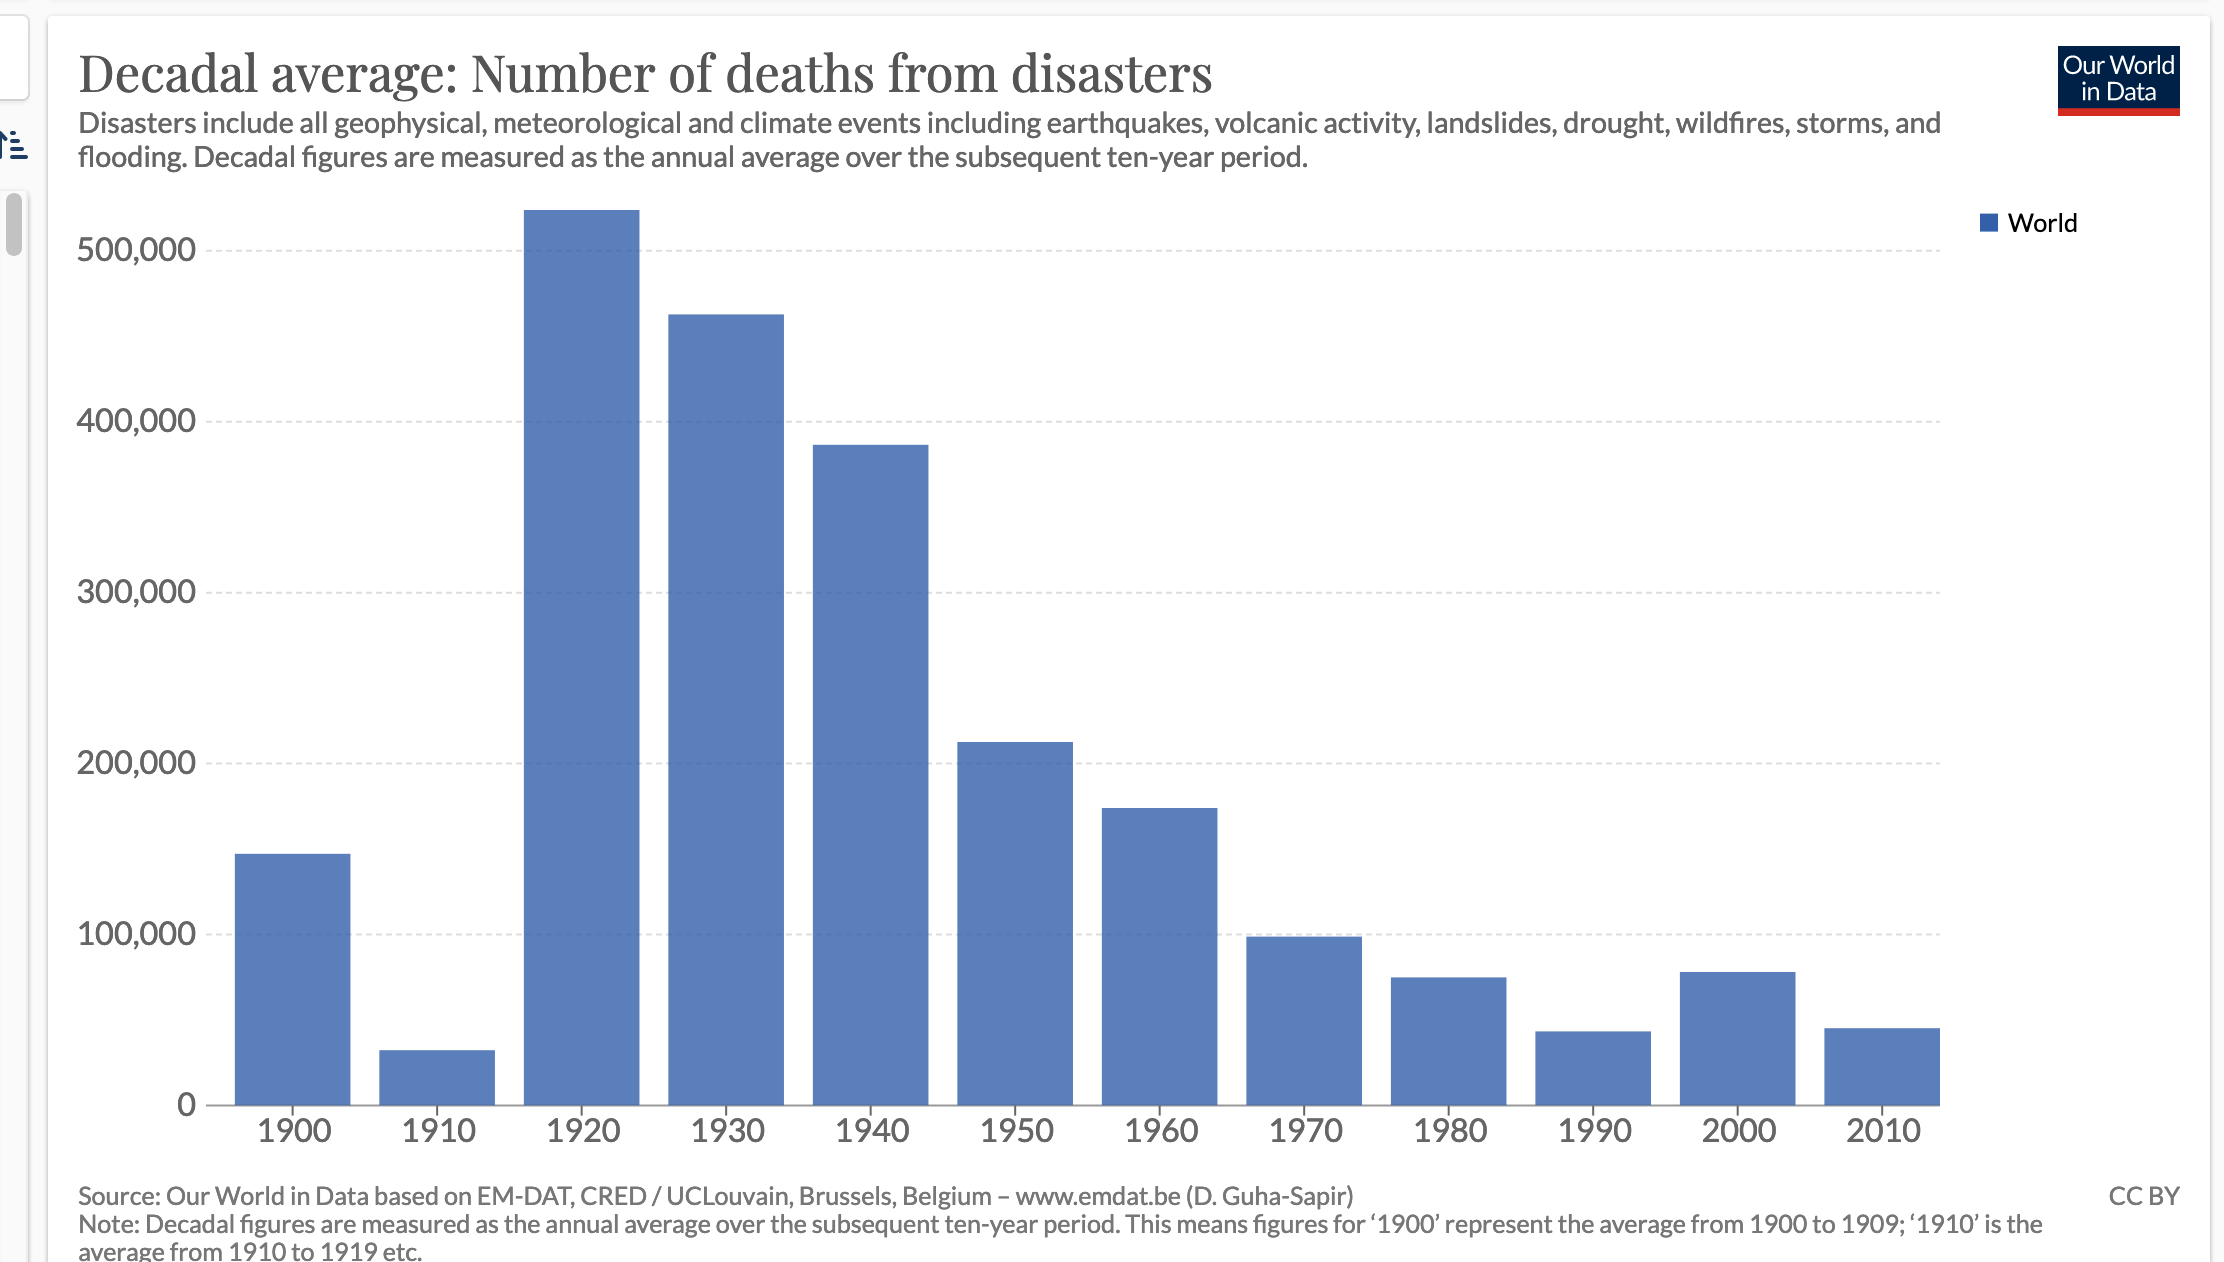 Global deaths from natural disasters have been dramatically declining over the past century of increasing CO2 levels and increasing temperatures. It is common to hear the insinuation that natural disasters are becoming more deadly due to climate change, but this is not true, the opposite is happening. While economic growth is undoubtedly responsible for much of this decline, another reason could be due to the overwhelmingly greater lethality of cold weather than hot weather.
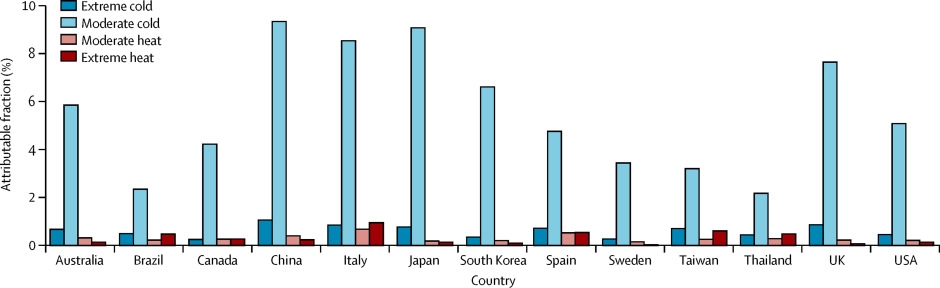 (the Lancet archive) Global deaths from temperature causes are enormously more due to cold than heat, with cold weather causing over 17 times as much death as heat. The increase in temperature so far, while causing more heat related deaths, by reducing far more cold deaths since cold weather is far more lethal, has been estimated to save a net 200,000 lives per year.
E. Whether the economic costs of tighter CO2 restrictions and regulations are less than the benefits from the reduction in climate change caused by that policy: Public policy, especially economic policy, has a long history of achieving the opposite effects of its original intent. (Hazlitt) After the Kyoto Protocol (a binding international agreement to reduce greenhouse gas emissions) was signed, instead of speeding up clean energy adoption, the signatories' rate of clean energy adoption slowed, as did their improvement in overall carbon intensity. (Breakthrough Institute archive)
In 2020 due to the COVID-19 pandemic-related lockdowns, the vast majority of air, land, and even sea travel was halted for most of the year, worldwide. TSA reported a 96% drop in air travel, FlightRadar showed corresponding drops in active flights, and US vehicle miles traveled were cut by at least 2/3. Worldwide Beijing reported a 91.7% drop in traffic, and the oceans saw a near total cessation of operating cruise ships. US industrial production was nearly cut in half, and commercial office utilization was nearly eliminated. It is difficult to imagine any climate policy that would reduce CO2 production more. And yet, there was no discernible difference in even the rate of change of increase of CO2 in the atmosphere.
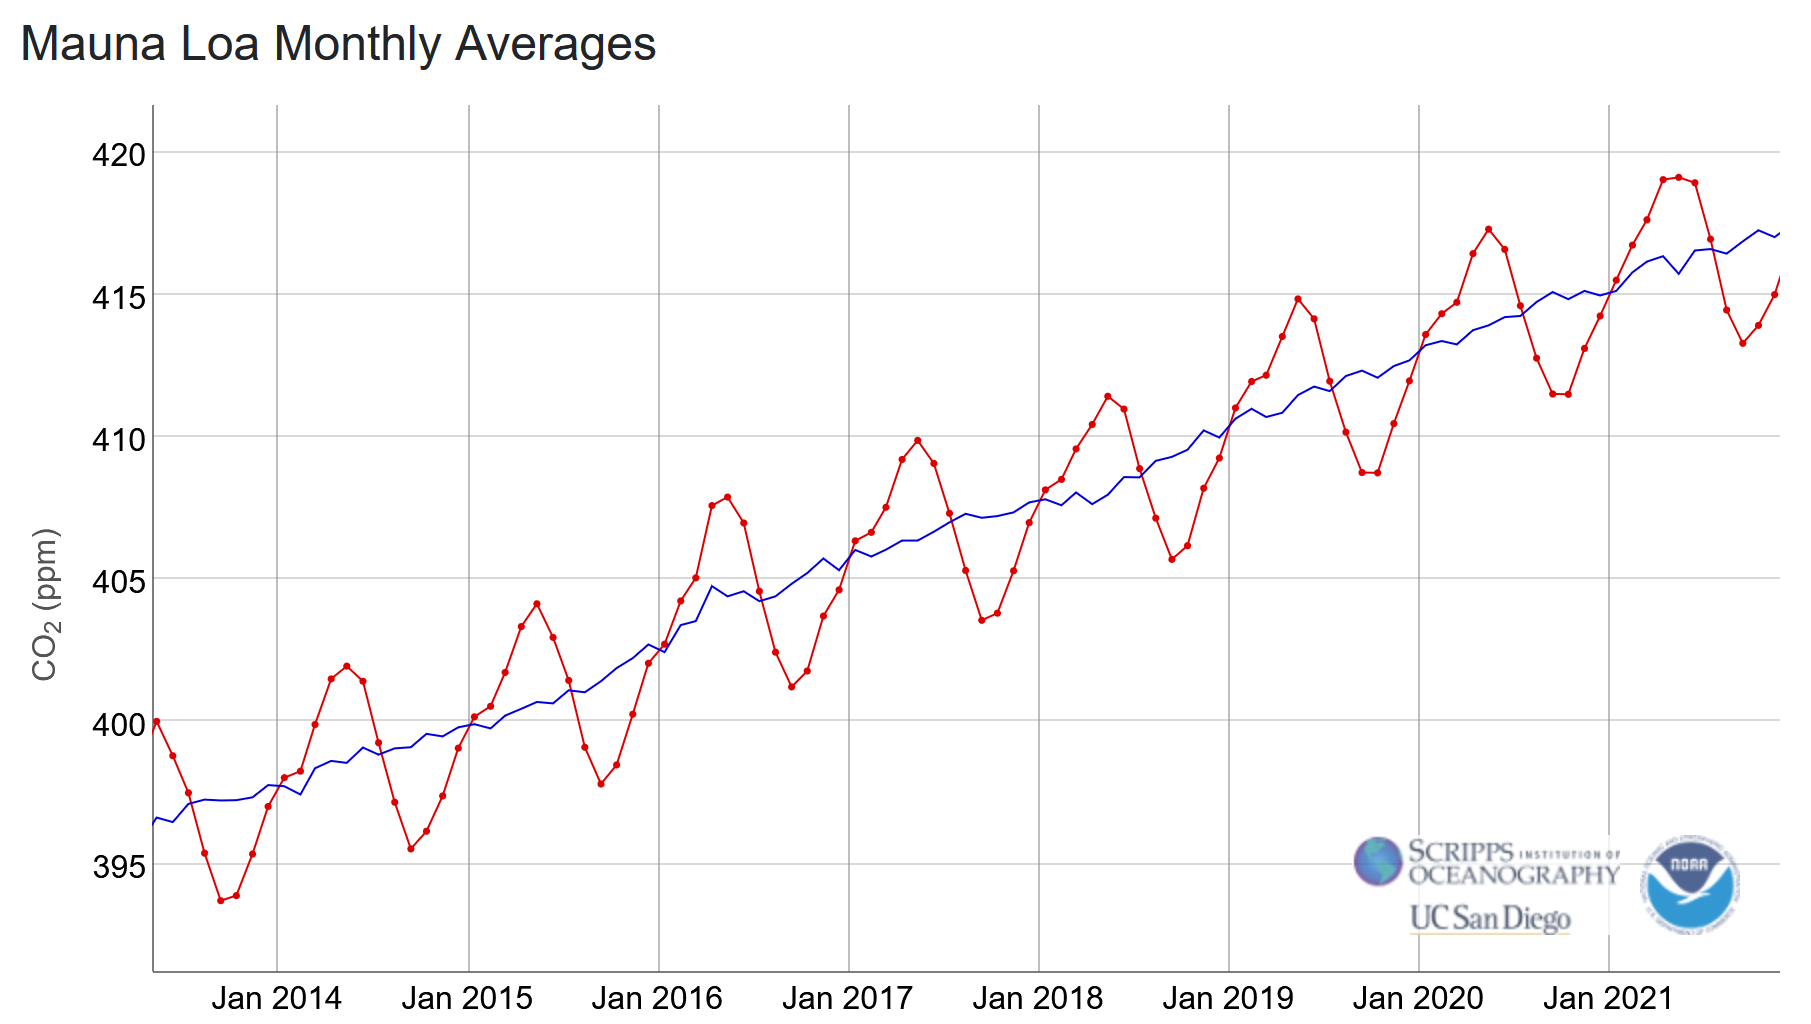 Unprecedented emissions cuts beyond that of any seriously considered policy or treaty failed to make any noticeable difference in even the rate of increase of atmospheric CO2 over the same years. (data from NOAA)
So in summary, there is solid evidence:
- The earth is warming.
- Global warming is currently largely driven by the increase in atmospheric CO2.
- Human activity is likely responsible for the increase in atomospheric CO2.
- Nearly all of the predicted negative effects of global warming have not come true despite the earth warming; and for the most directly negative predicted effects on humanity, the opposite has happened.
- Any legislative measures that reduce economic growth and opportunity, even by comparatively tiny amounts, is poised to have more direct, deadly effects than any potential advantage due to reduced warming. Also, legislative measures put in place to reduce CO2 emissions have been ineffective in curtailing CO2 emissions, and even massive curtailing of CO2 emissions has not changed the increase in atmospheric CO2.
Science is defined by the scientific method; making observations, formulating hypotheses, specifying testable predictions, and validating them. If the predictions are vague or do not match reality, it would not be wise to base decisions on them.
Postscript on name-calling: While you could call someone who does not acknowledge that the climate is warming or that it is driven by humans a "denier" you could also call someone a denier who does not acknowledge that the rate of global warming has been lower than predicted or that the predicted harms have not matched reality or who denies basic laws of supply and demand, etc. But in all cases, this kind of name-calling is almost certainly unproductive. Most likely, the individual is simply incompletely informed or has been listening to someone with a political agenda equivocating a small uncertainty or discussion of statistical model with a completely wrong interpretation.
As always, if there is a key piece of data I am missing that characterizes one of the central claims discussed here, I would be open to adding it.